How people lie with charts & data: an example from Fortune 500 CEOs
In my several years in strategy consulting, I learned about the many ways data, information and charts could be used to fit with an existing storyline.
Most of the time this is done in good faith but other times it enters into a grey area. There is a set of information that can be presented in many different ways, all being true, but one way of showing the data will align better with the message that the client team wants to share with the client. Within the context of consulting, the incentives are aligned so that the team will benefit from also helping the client so most of the times these teams enter into the grey area its often in good faith.
Increasingly, we see politicians, journalists, and individuals using these grey-area tactics to manipulate messages to confirm their existing beliefs. They don’t have a stake in the people they seek to influence so are merely focused on trying to increase the number of people that believe what they believe.
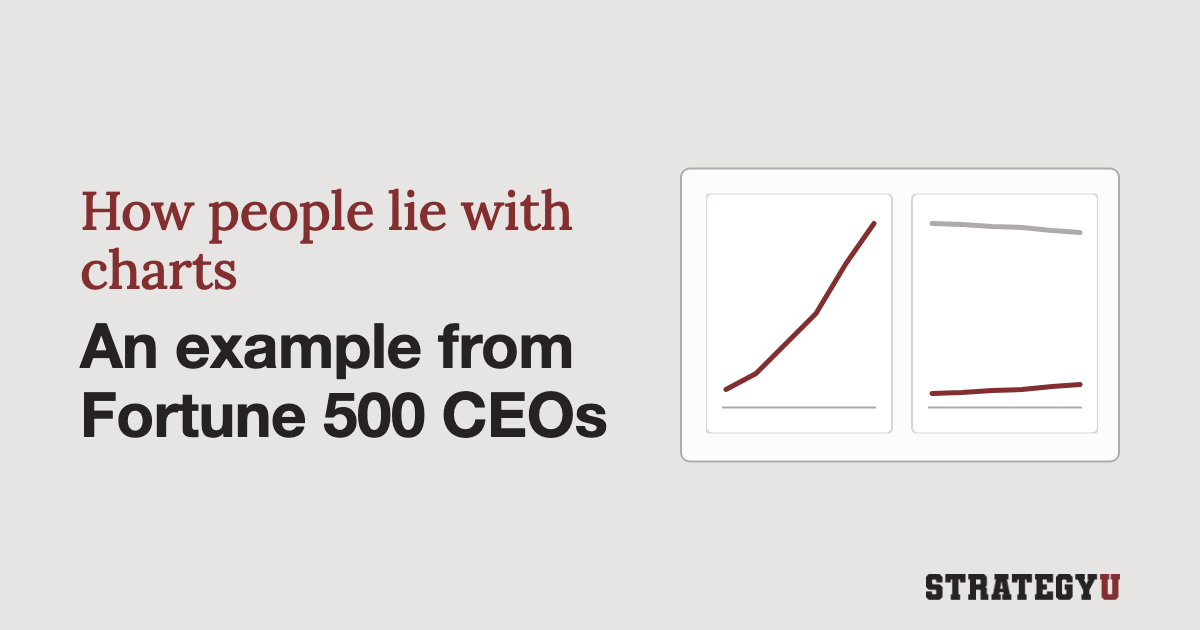
Many people struggle to defend themselves against this type of data manipulation. I want to walk you through a simple example of Fortune 500 CEOs to show you how a simple data set of 500 CEOs can be used to send many different messages.
Example 1: Highlighting a large disparity between men and woman

This version of the data set is intended to show that the number of men are dramatically larger than the number of women and then paired with a headline to make this fact more easily understood (phrases like “ten X for every one Y” are easy ways for people to understand numbers).
Example 2: Making the gender breakdown visual

This slide is similar to the first one except it has a block for every single CEO. This still shows a relatively small number of women CEOs but because each one has a block it may not feel as vast a gap as the first slide.
You could also use different colors with this slide to focus more on the women and highlight them as a “powerful” group within the larger group. Using a light grey makes the blocks of men seem a lot less dominating.

Example 3: Highlighting a time series of the # of women CEOs

In this one we ignore the number of men and only highlight on the number of women who have become CEOs over time. This one shows a positive trend and might be used if you are trying to convey a hopeful message or argue against people saying there has not been progress made.
Example 4: Highlight the positive trend of increasing women but also show the percentage of the total

This one pairs the positivity of the increasing trend with the offsetting message of the still relatively small percentage of women. It is still hard to get a sense that this is not a completely positive message because the scale of the number of men is missing, but after a few seconds of digesting the percentage, you get a fuller picture.
Example 5: Percentage of women and men on same time series

This builds on the last charge and adds the “missing” information of the percentage of men who are Fortune 500 CEOs. This one shows both the increase in the number of women over time while also showing that there is still tremendous progress to be made.
Beware of misinformation
Making sense of the information given to us in today’s world is more challenging than ever. Many cases of strong disagreements start with the understanding of the data itself. With Fortune 500 CEOs it would be hard to disagree with the raw data but with things like employment rates or deaths from Covid-19, there are disagreements on how to even count or track that information.
If you find yourself seeing data that makes you excited and confirms what you believe, ask yourself:
- What might be missing?
- Is this the best way to show the data?
- What is the intent of this presentation of information?
I hope this walk-through of some of the ways a simple set of information may be used in different ways.
The course
Think Like a Strategy Consultant
Structured problem solving, MECE, the Pyramid Principle, and slides that make a point, in one self-paced video course. 1,500+ students in 65+ countries.
Or 2 payments of $398.
Watch the free PowerPoint & Storytelling intro →Free
Start with the email course
Six short lessons on consulting fundamentals, one a day.